
Tracking Sedona Climate & Weather
Tracking Sedona Weather is not always the first question a client has when buying a home in Sedona. But as a client makes that decision to buy a home, they want to know what the weather or climate is like throughout the year. Many people have a false assumption that the weather is similar to Phoenix. The chart on the left was August 17, 2016 around 5 PM. 
Now, before those of you who live in the Phoenix start defending your weather. It was the Phoenix and Colorado River weather that brought us to Arizona. We used to take vacations in Palm Springs in the summer. Why? For a young family, vacations were cheaper in a city that all but shut down in the summer. Heat doesn’t bother us. (Well…. not too much!) After all, it is a dry heat and the kids were fishes. They loved to swim.
Humidity Not the Same…
Clients who are not familiar with Arizona do not realize that humidily is different here. You do not feel it. It is more of a danger for hydration than for comfort. Where as in many locations you can gasp for breath as you walk outside. It is not the same here. In winter, the cold is not biting. Generally, we wear a sweater. The last time a high temperature was below 32º was 1 day back in 2012. If you have read any other posts, you know that snow basically evaporates within a day or two. One other thing I bring up is running the air conditioner. Generally it is on less than 12 hours a day during the hottest time of the year. At night, windows are open 8 to 9 PM until 9-10 AM, the next day. I will also compare Sedona to Southern California weather. Most people want 4 seasons.

Not Too Hot Or Not Too Cold…..
Let’s face it, clients don’t want lots of snow or lots of heat.
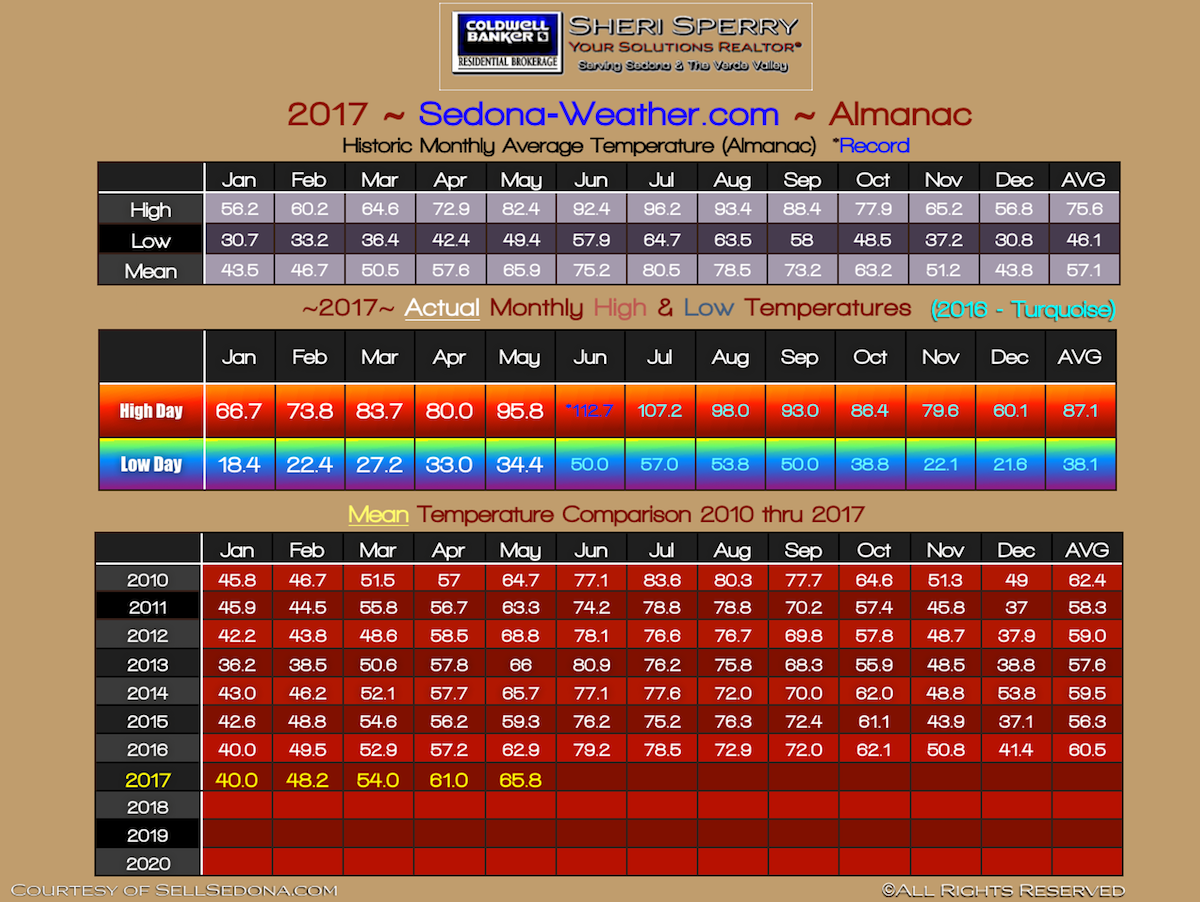
So this is a genuine concern. Because this question is asked from everybody who visits Sedona, my husband bought a weather station in 2010 and displays the weather in real time from our backyard. He has been drawn to it from his flying days. When you fly, you have to become somewhat of an expert and so it became a hobby!
He tracks many indices by month – It takes about
1/2 hour to track the indices below every month.
Here are some Categories being tracked….
Days with Precipitation by Month
Days with Sun by Month – New Category
Hottest Day of the Year
Days Over 100º
1st & Last Day of 100º
Number of Days over 90º but less than 100º
1st Day of 90º
Total Days over 90º
Coldest Temp of Year and Number of Days Below 32º
Days that dip below 32º
Days below 50º for a high
Here is the chart that tracks precipitation

;)